|
|
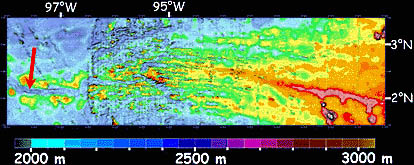
This map shows what the seafloor looks like in the area we have been exploring. The map was compiled using a variety of different data: single-beam echo-sounding data, multibeam sonar data, and satellite gravity data. The shallow (red colored) topography on the eastern (right) side of the map is closest to the Galapagos hotspot, which forms the volcanic islands in the Galapagos Archipelago. The Galapagos Rift is the narrow band of pink and red that extends to the west. You can see that the rift gets deeper and look less like a straight lines toward the west. In this area, the mid-ocean ridge has a rift valley, rather than a crest or dome shape. The red arrow points to the area on the Galapagos Rift that we will be surveying and the general area of the next two slides.
|
© 2010 Dive and Discover™. Dive and Discover™ is a registered trademark of
Woods
Hole Oceanographic Institution
