|
|
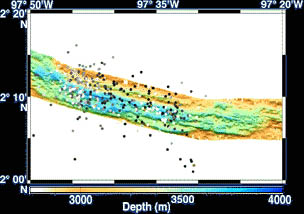
A multibeam bathymetric map, shown as a shaded-relief image, that Uta Peckman produced using the data we collected last week. The seafloor appears as if it were illuminated from the south. The seismic epicenter locations analyzed by Maya Tolstoy, Julia Getsiv and Chris Fox are shown as black, gray or white dots. The black dots represent earthquakes that occurred first. The gray dots are earthquakes that occurred next, and the white dots are the most recent earthquakes that took place in a swarm about 18 months ago. The small yellow stars are seismic events detected by the land-based global seismic network. The next slide shows a 3-D image of this multibeam sonar data.
|
© 2010 Dive and Discover™. Dive and Discover™ is a registered trademark of
Woods
Hole Oceanographic Institution
