


« Previous
The scientists looked at this graph countless times
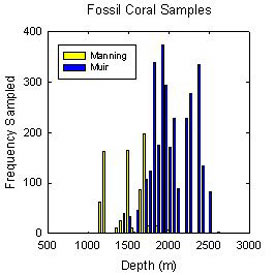
as the cruise went on. It shows the number of fossils that were collected
at each depth in the ocean, separated according to Manning and Muir seamounts.
Each day Alvin came back with more fossil corals, new bars were added
and old bars were extended. Despite the fact we had one-third of our
dives cancelled due to weather and mechanical problems, this graph testifies
to the cruise’s remarkable success in filling out almost the entire
depth range. In a meeting with his group earlier this spring, Chief Scientist
Jess Adkins said 2,000 samples would be “awesome.” They'll
be going home with around 3,500.
« Back
to today's update
| 