|
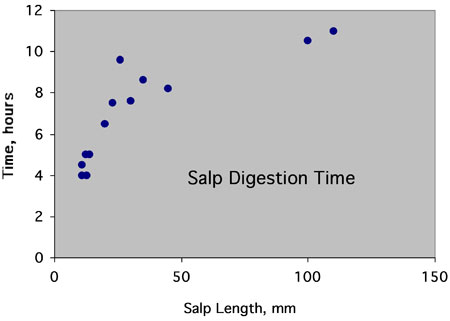
This graph shows the time it takes a salp to move food completely through its gut, in relation to the size of the animals. Thirteen animals were tested, by feeding them tiny beads that can be seen in their fecal pellets with a microscope. The salps’ fecal pellets were collected often until the beads come through. The time from when they were fed is the total digestion time. In this graph, small salps have a faster digestion time than large salps. (Data from Pat Kremer, University of Connecticut, L.M. Gould cruise, 2006)
|
Mailing List | Feedback | Glossary | For Teachers | About Us | Contact
© 2010 Dive and Discover™. Dive and Discover™ is a registered trademark of Woods
Hole Oceanographic Institution
